
Running Your First A/B Experiment
Miso’s A/B testing feature enables you to create experiments that split your site visitors into control and treatment groups and compare the performance of search and recommendation variations. Throughout the course of the A/B test, you can track many different metrics in real-time.
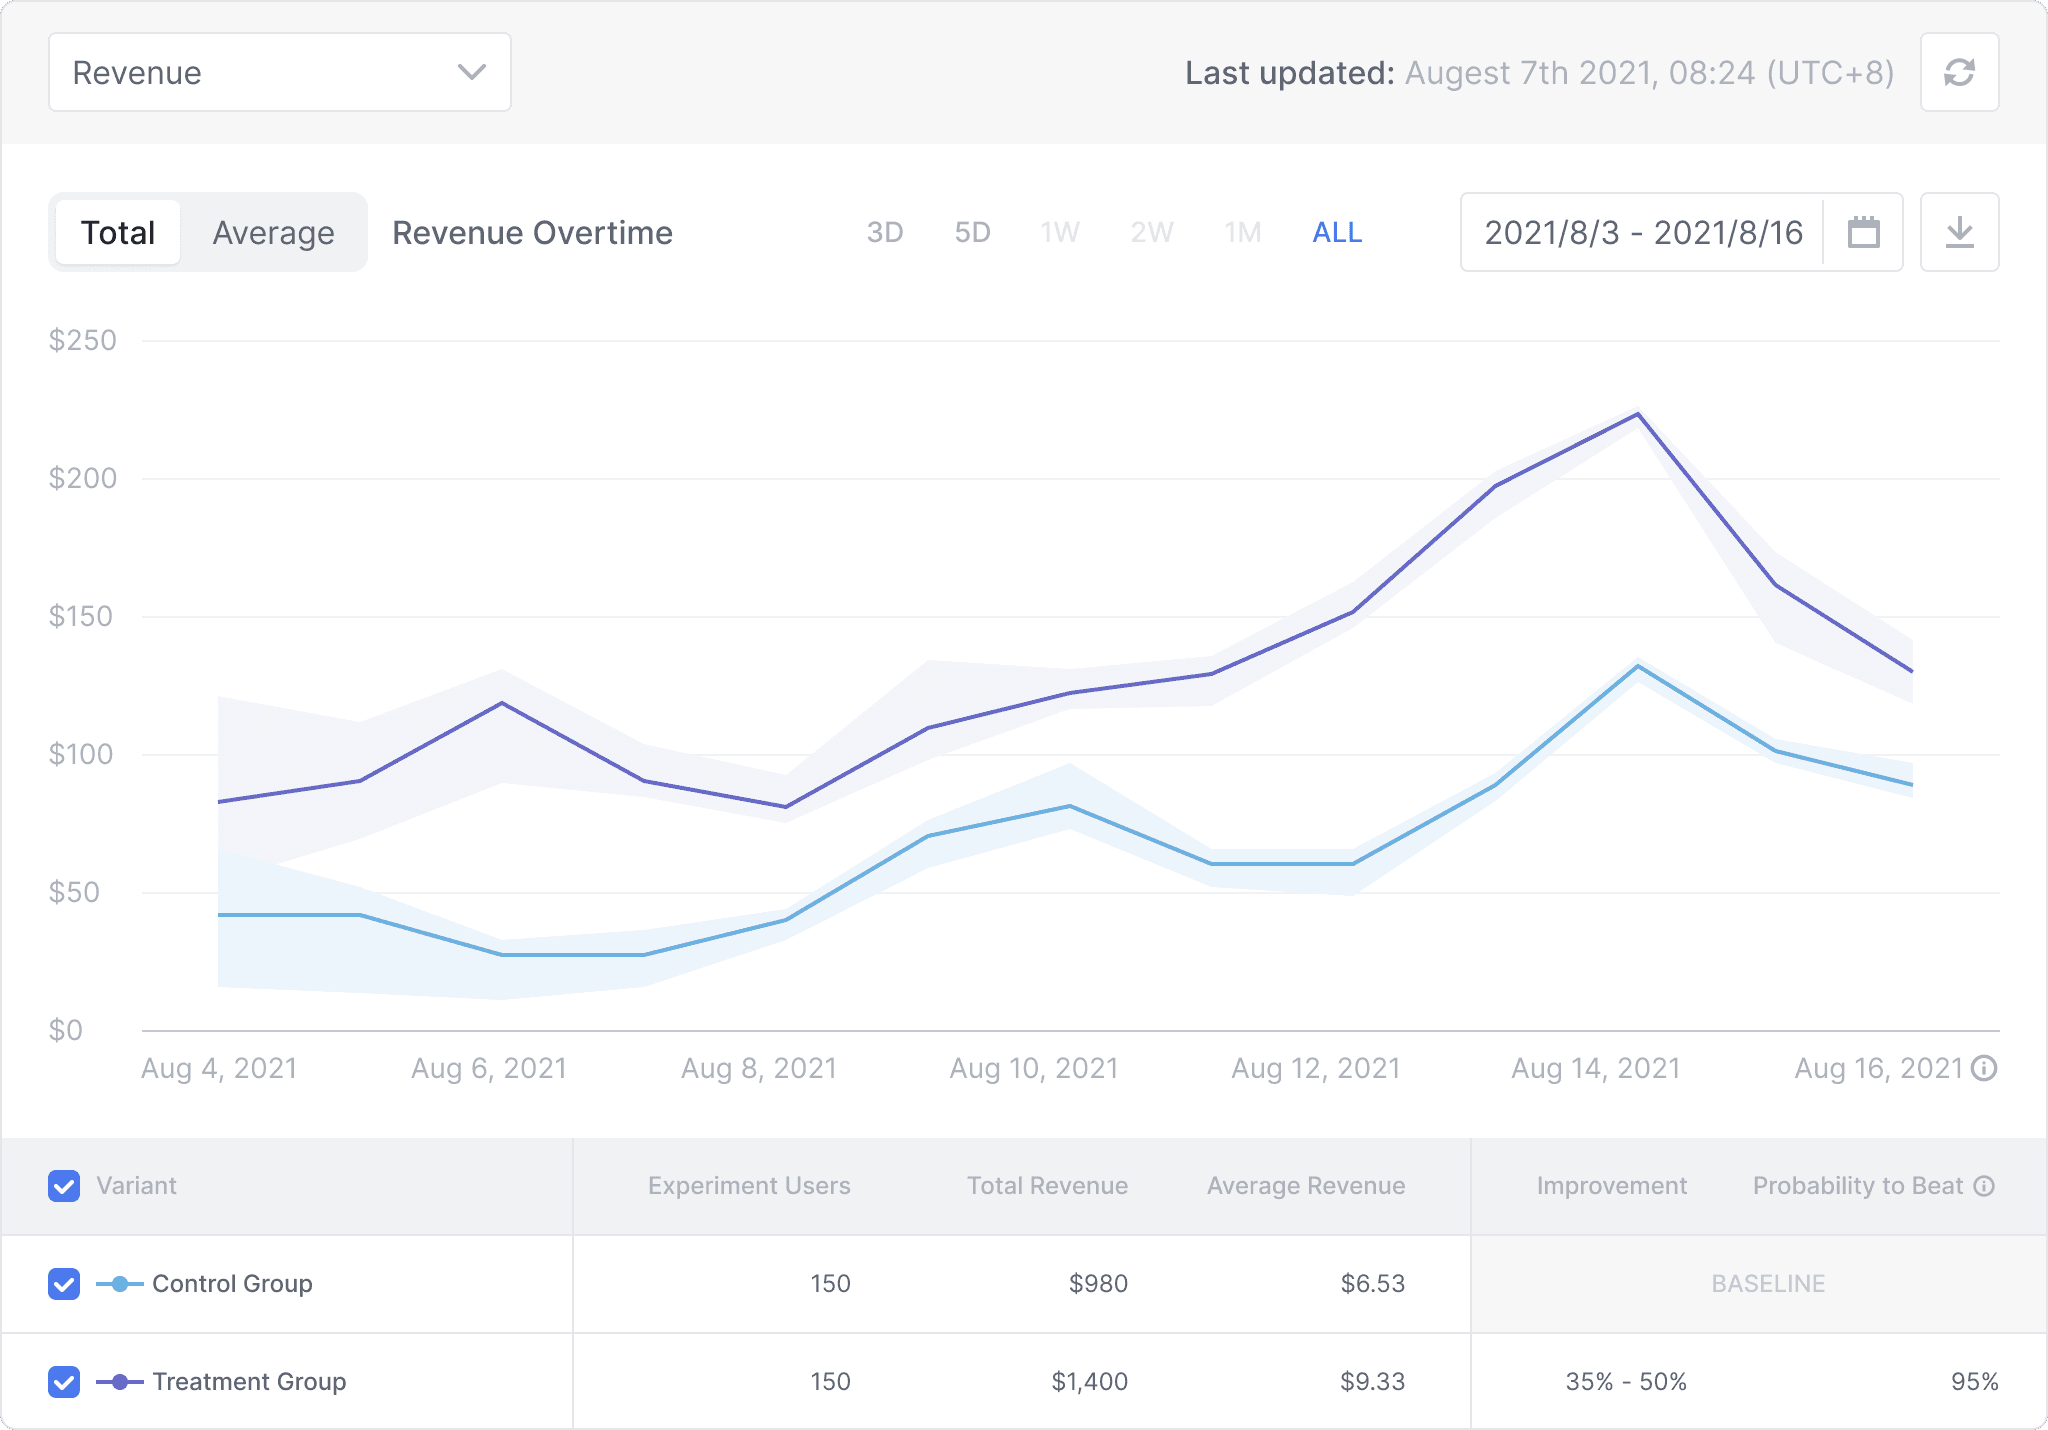
Figure 1 — Miso provides an Analytics dashboard to track the results of your A/B test
Setting up an A/B Experiment
-
Log into Dojo and navigate to the A/B Experiments page.
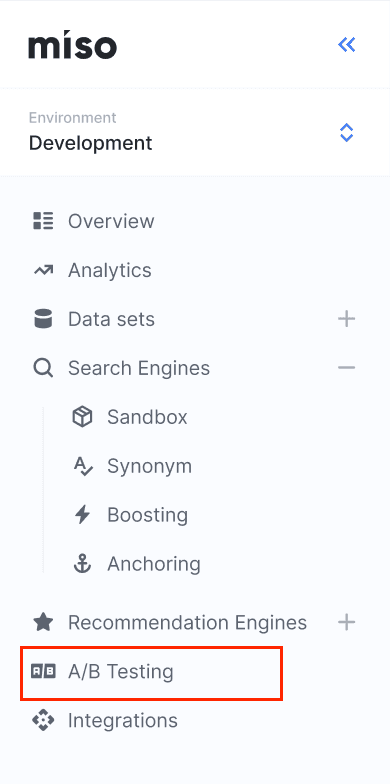
Figure 2 — Dojo navigation pane
-
Select Create Experiment.
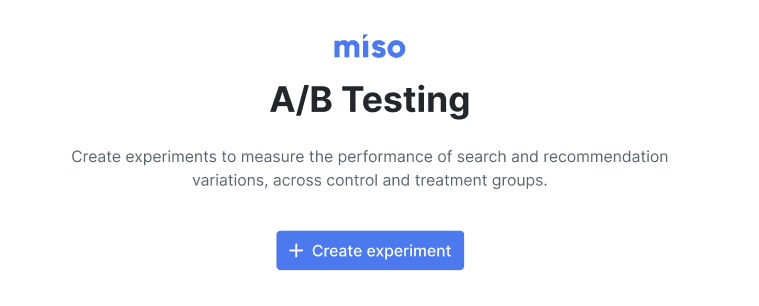
Figure 3 — If this is your first A/B test, you'll see this landing page
-
Provide a descriptive name, and optionally an objective, for your experiment. Select Confirm.
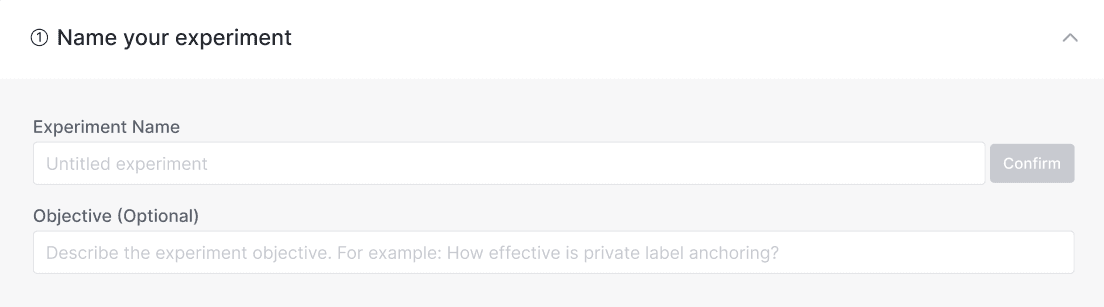
Figure 4 — Naming your A/B test
-
Next, you may optionally rename the control group and treatment group from their default values.
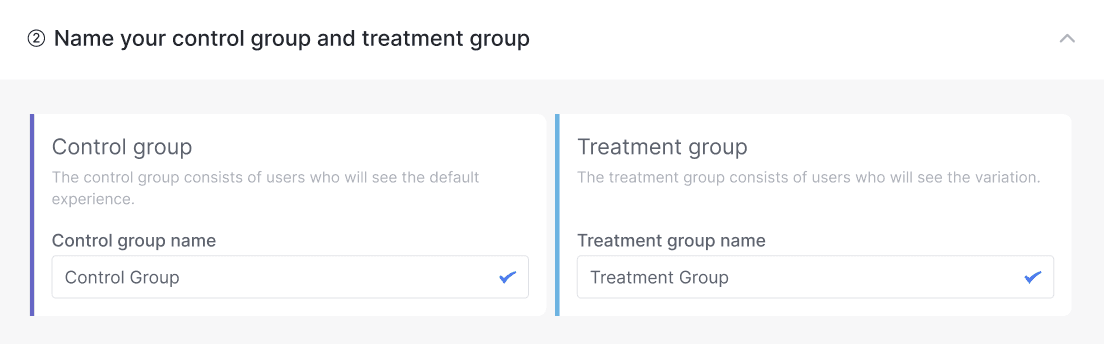
Figure 5 — Naming your control and treatment groups
-
In the Set traffic volume between control and treatment group section, use the slider to adjust the ratio of users that see the control variation and the treatment variation.
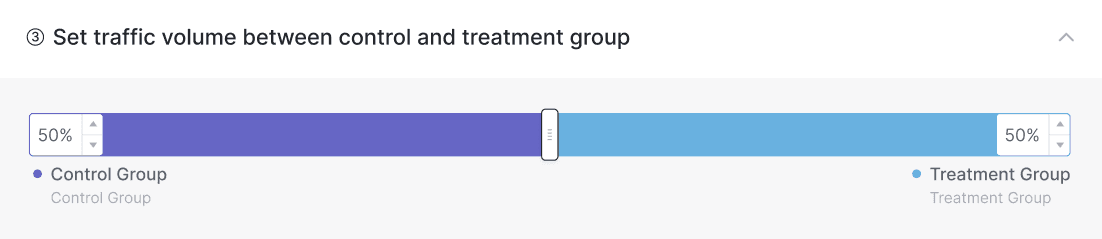
Figure 6 — Fine-tuning the proportion of treatment group and control group users
-
Next, in the Schedule section, choose whether to launch the experiment immediately or on a particular start date.
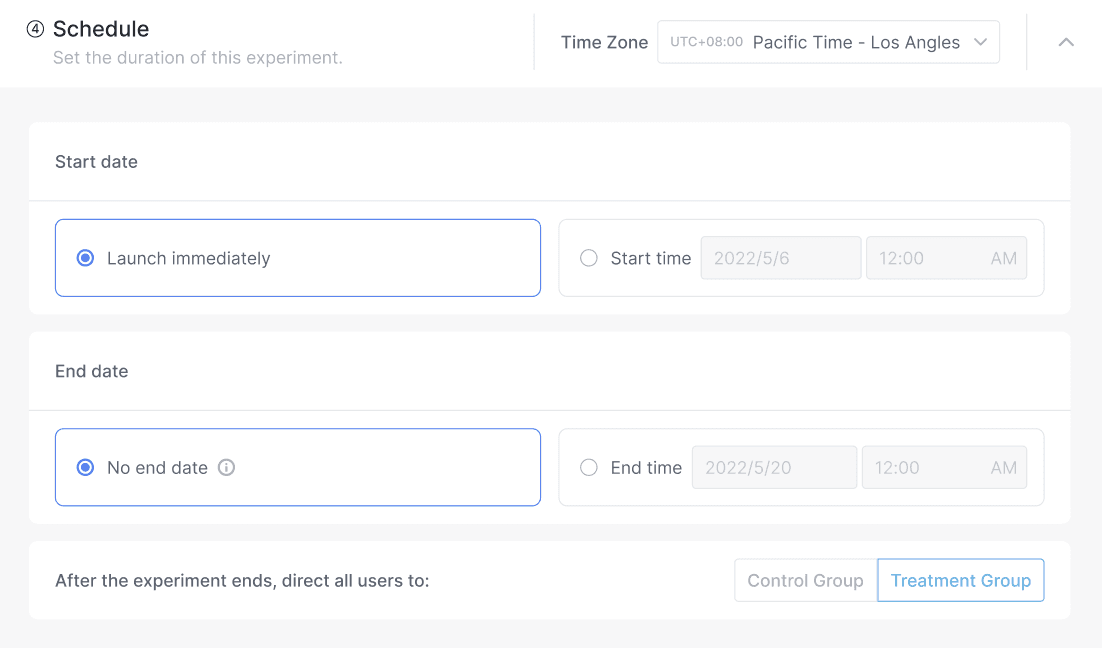
Figure 7 — Choose when to start and end your A/B experiment
-
If you would like to run the A/B Experiment for a limited time, select an End date. Otherwise, the A/B Experiment will continue indefinitely.
-
If you set an end date, choose the default variation that users will see once the experiment concludes by selecting either the Control Group or Treatment Group.
-
Miso will assign site visitors into the Treatment or Control Groups at random. If you would like to force certain internal users into a particular group, can you edit their assignment in the Add group assignments for internal users section**.**
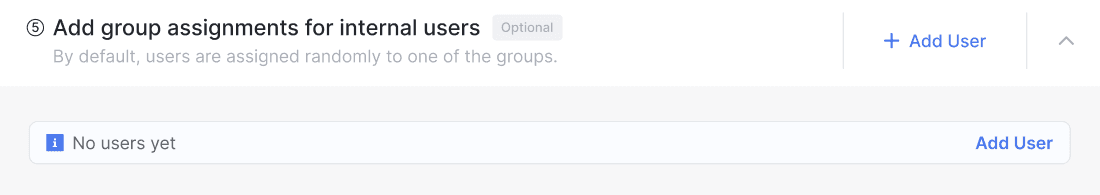
Figure 8 — Which variation should your users see when the experiment has concluded?
-
Select Launch Experiment when you’re finishing filling out the A/B Experiment details.
-
The next step is to configure the A/B Experiment on your site, which will be explained in the following section.
Implementing an A/B Experiment
Once you’ve configured and launched the A/B Experiment from Dojo, the next step is to create the control and treatment variants on your site. The following example uses Python, but you can implement a similar process in the language of your choice.
-
First, we’ll define a function that returns the group membership (control or treatment) for a given user:
import requests

def get_user_experiment_info(api_key, experiment_id, user_id):
    """ sample code to get user or anonymous treatment """
    data = {"user_id": user_id}
    endpoint = f'https://api.askmiso.com/v1/experiments/{experiment_id}/events?api_key={api_key}'
    return requests.post(endpoint, json=data).json()
Figure 9 — A python function to retrieve the group member for a particular user
-
Next, let’s get some important details about the A/B experiment instance:
api_key = "<YOUR_API_KEY>"
experiment_id = "<EXPERIMENT_ID>" # found in dojo
user_id = "user_1234"  # user for which to assign a group
user_experiment_info = get_user_experiment_info(
    api_key, experiment_id, user_id)
Figure 10 — Defining variables in python that hold details about the A/B experiment
-
Finally, we define the behavior (or variant) that the user should experience, based on their group membership. This can be a certain type of recommendation, filtering, or a merchandising technique:
if user_experiment_info["in_experiment"]:
    variant = user_experiment_info["variant"]
    # get configuration if need
    if variant["name"] == "treatment":
        # insert code here to show "treatment" variant
        pass
    elif variant["name"] == "control":
        # insert code here to show "control" variant
        pass
    else:
        # unexpected variant name. raise error
        raise RuntimeError(f'Unexpected variant name {variant["name"]}')
else:
    # insert code here to show default UI (often the same as the "control" variant)
    pass
Figure 11 — Using an IF loop in python to determine the variation that a user sees
Tracking analytics of an A/B experiment
Once the A/B Experiment has been configured in Dojo and implemented on your site, you can utilize Miso’s Analytics dashboard to track metrics related to your experiment in real-time.
-
Log into Dojo and navigate to the A/B Experiments page.
Figure 12 — Dojo navigation pane
-
Select the experiment for which you would like to see analytics.
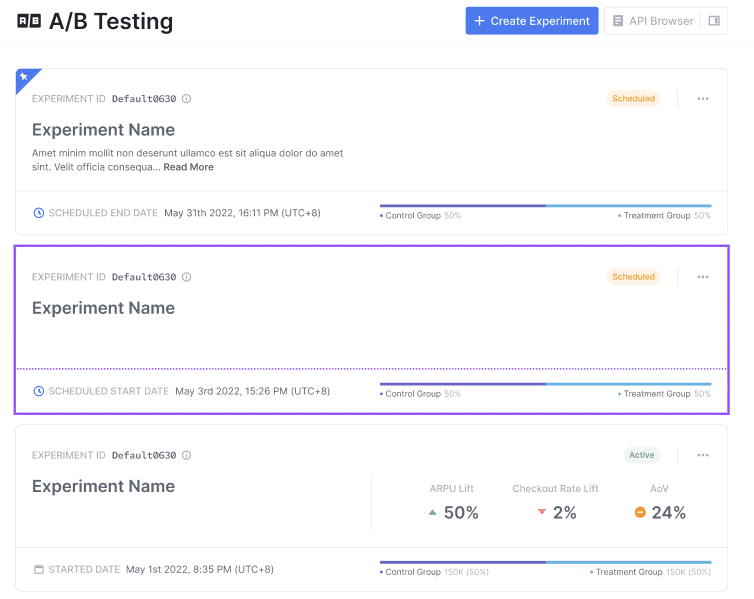
Figure 13 — Select a previously created A/B experiment to see the results
-
The default metric shown is Revenue. Using the drop-down menu, you can select from many other e-commerce metrics such as Add to Cart Rate, Checkout Count, and Average Order Value. The time series graph will be automatically updated, as well as the breakdown by control and treatment groups.
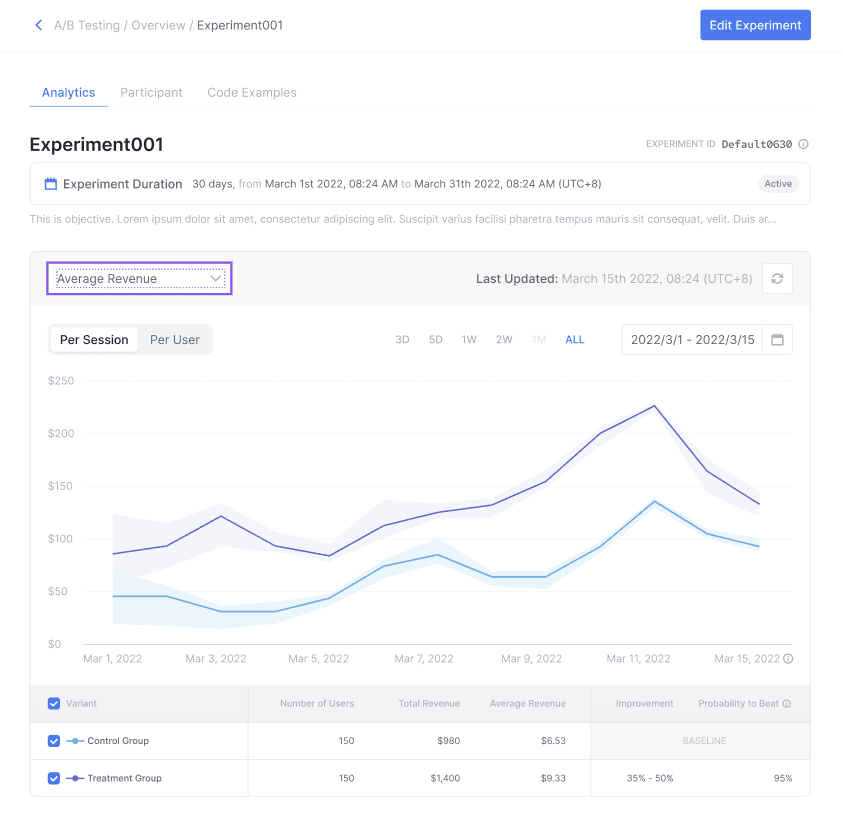
Figure 14 — The Analytics dashboard provides many important metrics to help you gauge the efficacy of your experiment